Record Gubernatorial Turnout in 2021
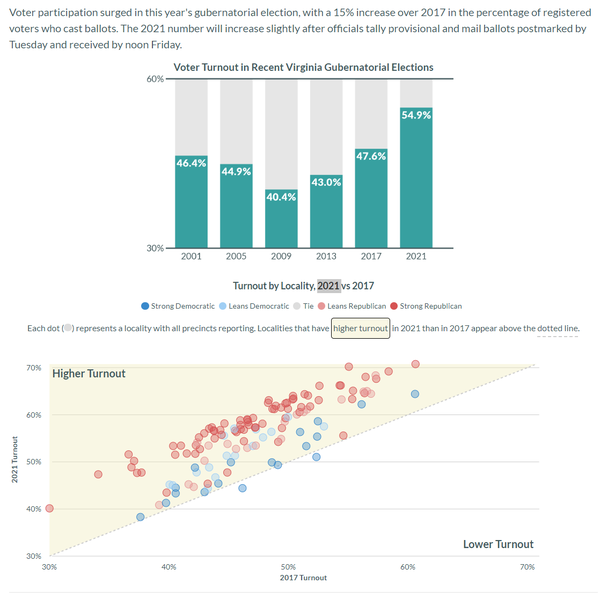
A bar chart showing the history of turnout in elections for Governor, and a scatterplot chart showing the change in turnout vs. the partisanship for each locality
This resource was made possible in part through a grant from the Claude Moore Charitable Foundation
Amplify Your Impact!
Did you use one of these resources? Please share it with us!
Share it with your network:
Like what you see? Get updates when new resources debut